Interracial violent crime in the US
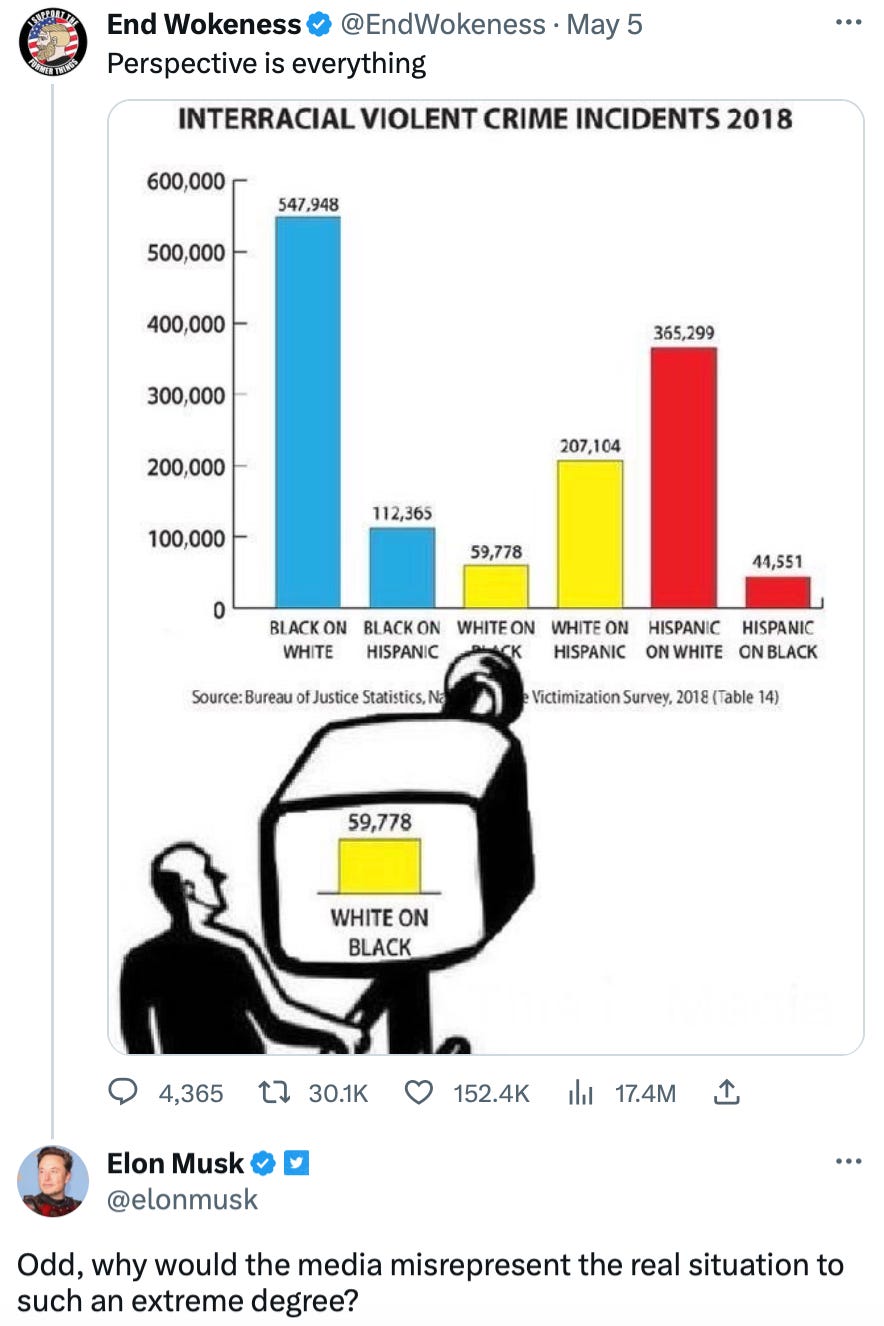
There was recently a controversy on Twitter about interracial violent crime in the US after someone posted a chart showing that black on white violent crime is far more common than white on black violent crime and implicitly criticizing the media for misrepresenting the situation by focusing on white on black violent crime.
The tweet in question received a lot of attention after Elon Musk replied to it and, as you can see, more or less endorsed that critique of the media.
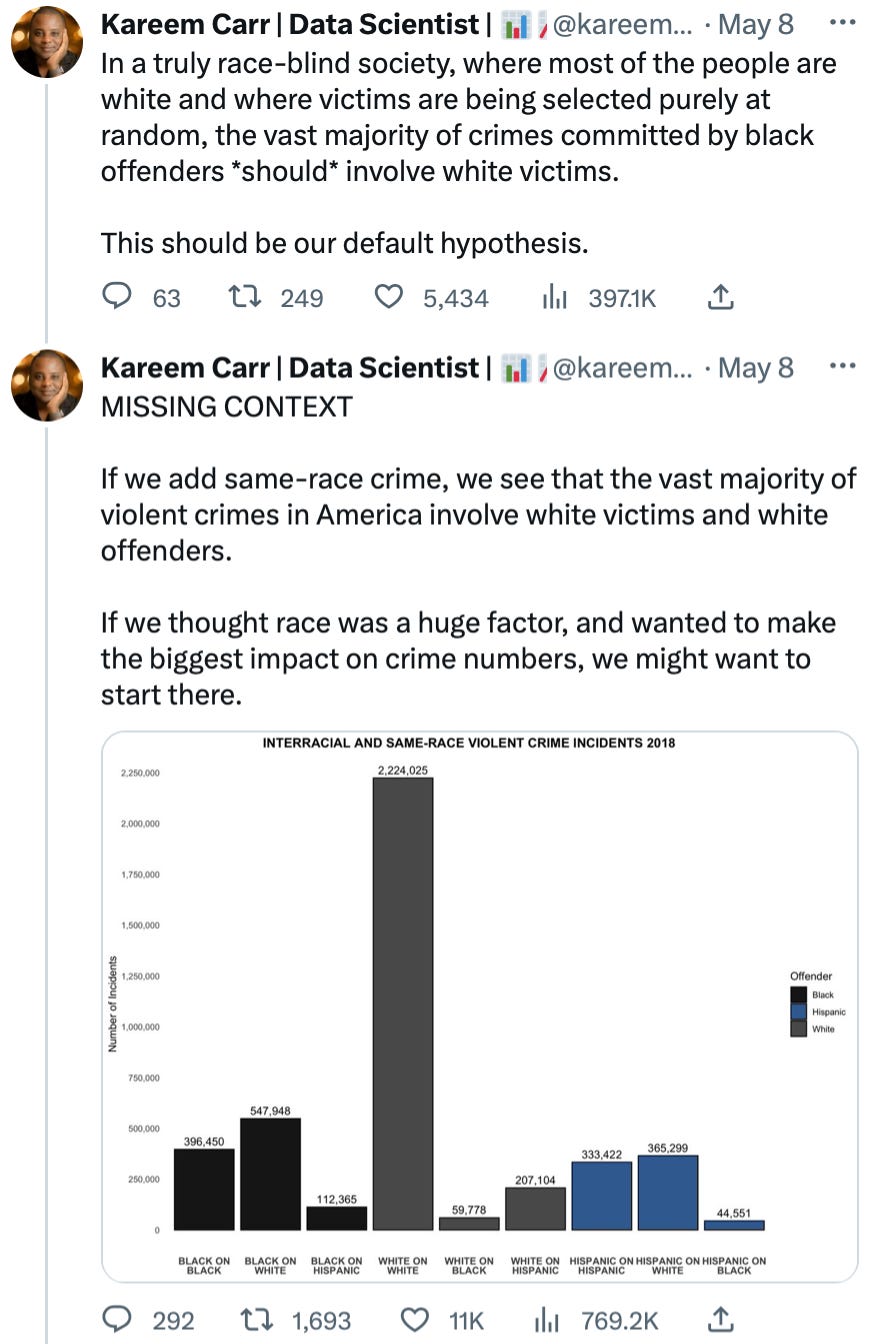
This prompted a response by Kareem Carr, a PhD candidate in biostatistics at Harvard, who argued that the chart was misleading. His main point is that while the chart makes it seem “as if black offenders are going out of their way to seek out white victims”, since white people are the majority in the US, you would expect the majority of crimes committed by black people to involve white victims even if criminals selected their victims purely at random. By the same token, you would expect white people to be victimized by other white people far more often than by black people, but the chart obfuscates this fact by only showing interracial violent crime and omitting intraracial violent crime. Carr shows that, when you use the same data that was used to make the original chart, this prediction is verified:
The gist of Carr’s thread is that patterns of interracial and interracial victimization are exactly what you would expect given the racial/ethnic distribution of the US population.
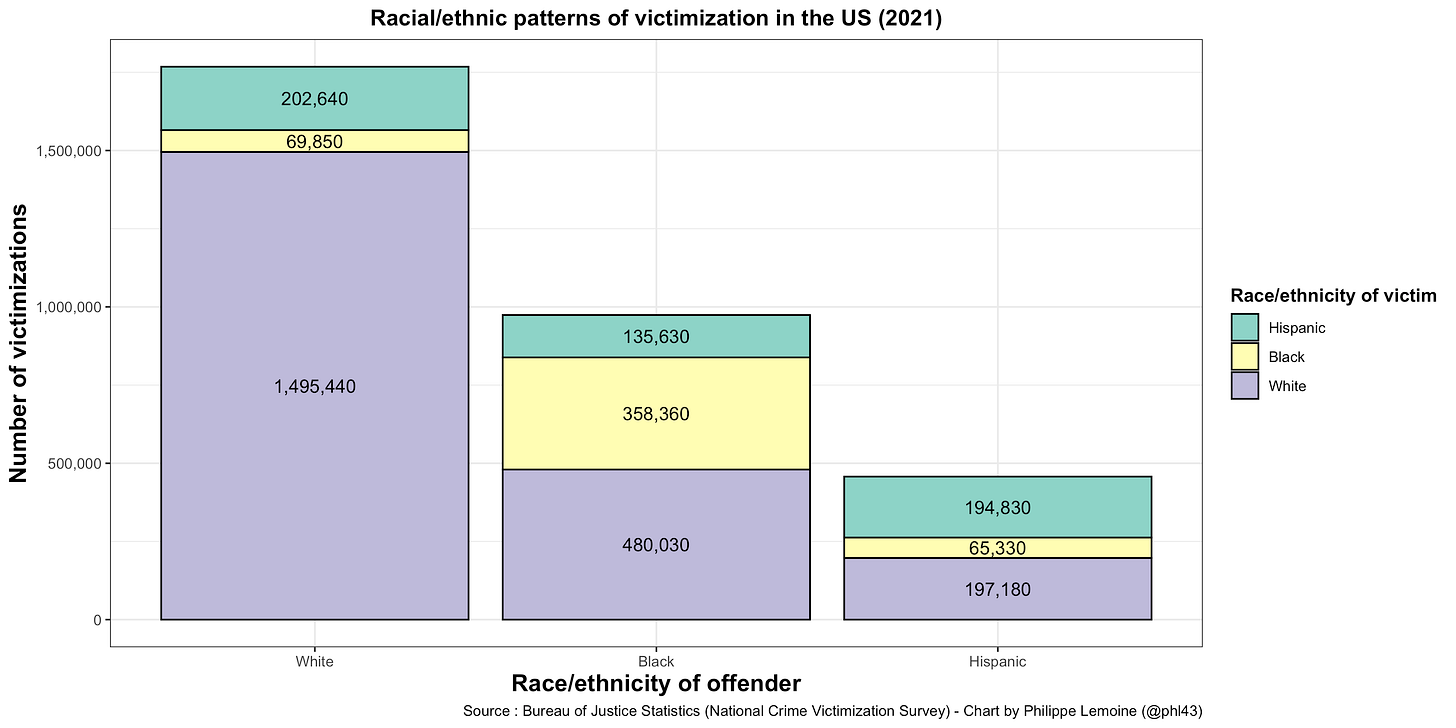
In this post, I want to explain why this claim is no less misleading than the original chart Carr was criticizing, and arguably more.1 First, I’m going to start by replicating Carr’s chart, but I will present the data in a somewhat different way because I think it makes the chart clearer. I will also use the National Crime Victimization Survey (NCVS), which is the source of the data used by Carr and for the original chart he was criticizing, but I’ll use data from the 2021 edition of the survey because it’s the most recent that is currently available.2 The result is very similar, except for the presentation, to the chart made by Carr:
As you can see, while a plurality of the victims of black violent offenders in 2021 were white (almost 50% of them), the vast majority of white victims of a violent crime (more than 2/3 of them) were attacked by another white person. Only about 22% of white victims of a violent crime were attacked by a black person. This is hardly insignificant, but still a clear minority. As Carr pointed out, since white people are the vast majority of the population, it’s not really surprising that many victims of black criminals are white. Even if black criminals didn’t have a preference for white victims, but selected their victims purely at random, you would expect them to commit more violent crimes against white people than against other people just in virtue of that fact.
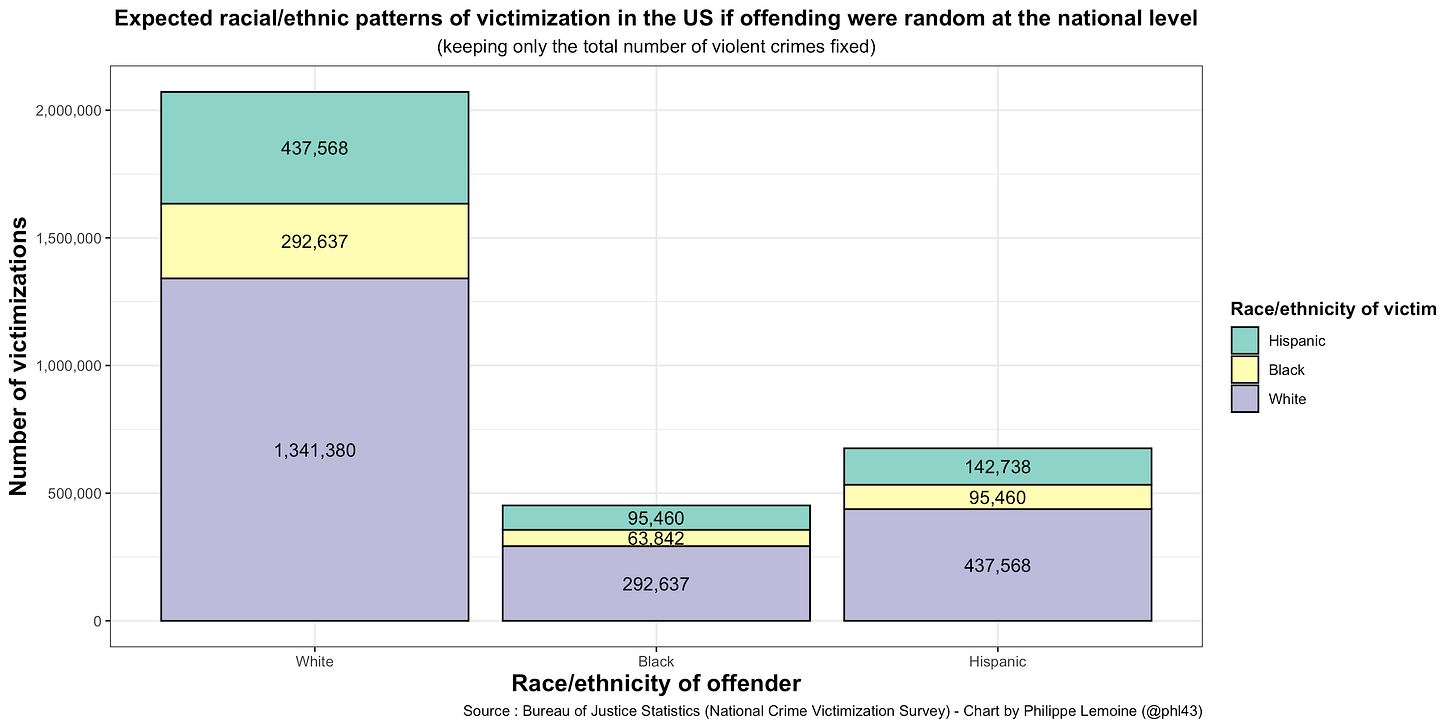
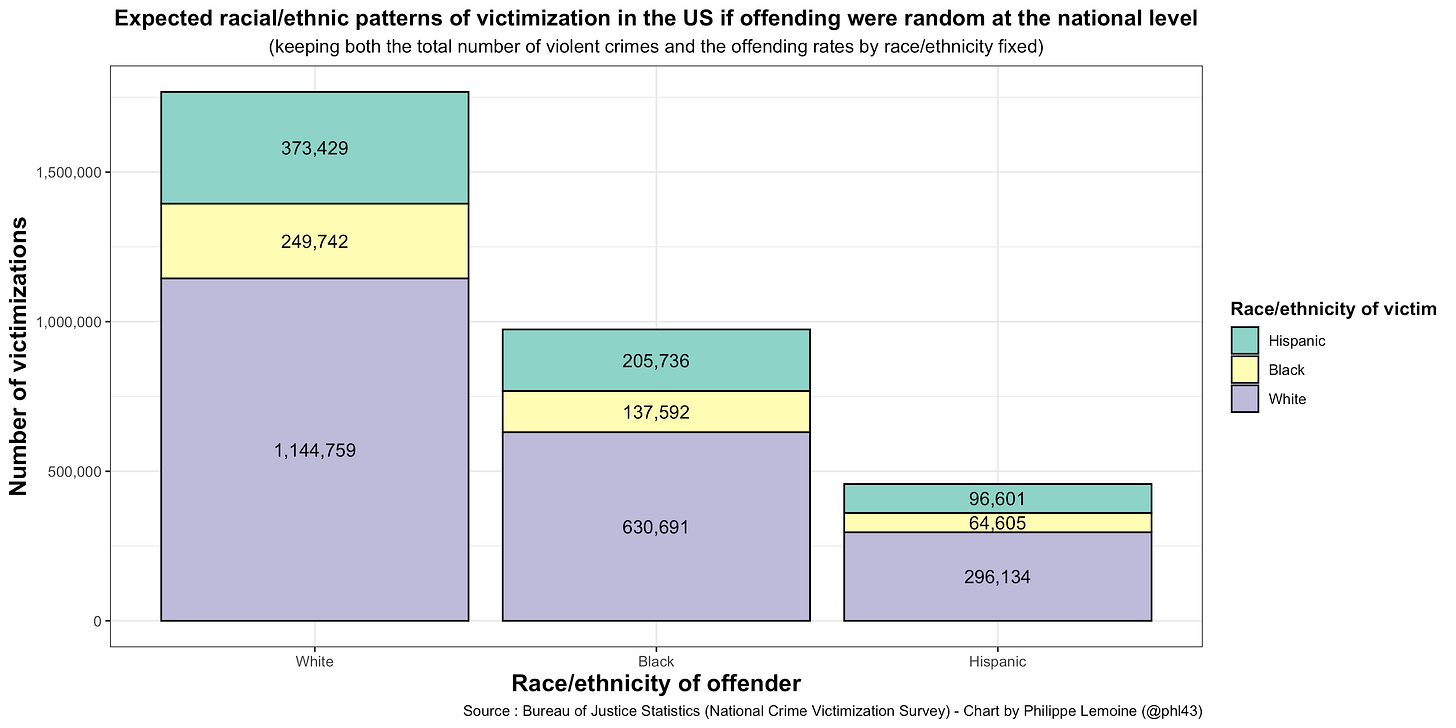
However, depending on how different the observed racial/ethnic patterns of victimization are from what one would expect in such a counterfactual, they could still be consistent with the hypothesis that black criminals do in fact have a preference for white victims. Carr complains that the original chart makes it seem “as if black offenders are going out of their way to seek out white victims”, but he doesn’t actually discuss how different the actual data are from what they would be if criminals selected their victims purely at random, making it seem as if the observed racial/ethnic patterns of victimization were consistent with that hypothesis. Here is what it would look like if, keeping the overall violent offending rate constant, there were no racial/ethnic differences in offending rates and criminals victimized people of different races/ethnicities randomly with probabilities equal to their share of the population at the national level:
As you can see, in this counterfactual, the racial/ethnic patterns of victimization look completely different from the observed patterns in the actual world. Not only does the racial/ethnic distribution of victims for each group of offenders is completely different from the distribution in the observed data, but so is the number of crimes that people in each racial/ethnic group commit. In particular, black criminals are responsible for vastly more violent crimes in the actual world than in the counterfactual I just described, because black people in the US have a much higher violent offending rate than whites and hispanics. In fact, according to the NCVS, black people commit violent crimes at 2.5 times the rate of white people, while hispanics commit violent crimes at a slightly lower rate than white people.3 This is why, as the previous chart showed, black people commit more than twice as many violent crimes as hispanics despite being much less numerous.
We can try to address the fact that criminal behavior is not distributed identically across racial/ethnic groups, but that different racial/ethnic groups have different violent offending rates, by using a different counterfactual in which each racial/ethnic group have the same violent offending rate they have in the actual world but still select their victims purely at random. Then, by comparing the racial/ethnic distribution of victims for each group of offenders with the same distribution in the observed data, we might be able to tell how much violent criminals of each race/ethnicity depart from a model in which they select victims of different races/ethnicities randomly with probabilities equal to each racial/ethnic group’s share of the population at the national level. Here is what the racial/ethnic patterns of victimization would look like in such a counterfactual:
As you can see, the number of violent crimes committed by each racial/ethnic group is the same as in the actual world (which is not surprising since the counterfactual was constructed in such a way as to ensure it would be the case), but the racial/ethnic distribution of victims for each group is still completely different. For instance, white people would commit 3.5 times more violent crimes against black people than they actually do, while black people would commit 30% more violent crimes against white people. Both white people and black people would also commit far less violent crimes against members of their own group than they actually do.
It would be tempting to conclude that, despite the fact that black people commit a large number of violent crimes against white people, the comparison with that counterfactual shows that it’s because they have a relatively high violent offending rate and in fact they actually have a preference for black victims, but that would be wrong. Indeed, this counterfactual is based on a model that is completely unrealistic, because it assumes that criminals select their victims randomly with probabilities equal to each racial/ethnic group’s share of the US population at the national level. This would be the case in the absence of racially-biased preferences for victims among criminals if people of different races/ethnicities were distributed uniformly across the US or if criminals were not more likely to select victims who live near them, but neither is the case since neighborhoods are heavily segregated along racial/ethnic lines in the US and violent criminals tend to victimize people who live near them. If we are trying to create a counterfactual in which criminals don’t have racially-biased preferences, we should try to take into account patterns of residential segregation in the US somehow. A better model to construct such a counterfactual is one in which criminals select their victims randomly with probabilities equal to each racial/ethnic group’s share of their neighborhood. This is still not completely realistic, because even if criminals don’t have racially-biased preferences for victims they will sometimes victimize people who don’t live in their neighborhood (since criminals sometimes victimize people outside of their neighborhood and people who don’t live over there sometimes come to their neighborhood where they are victimized), but it’s nevertheless much better.4
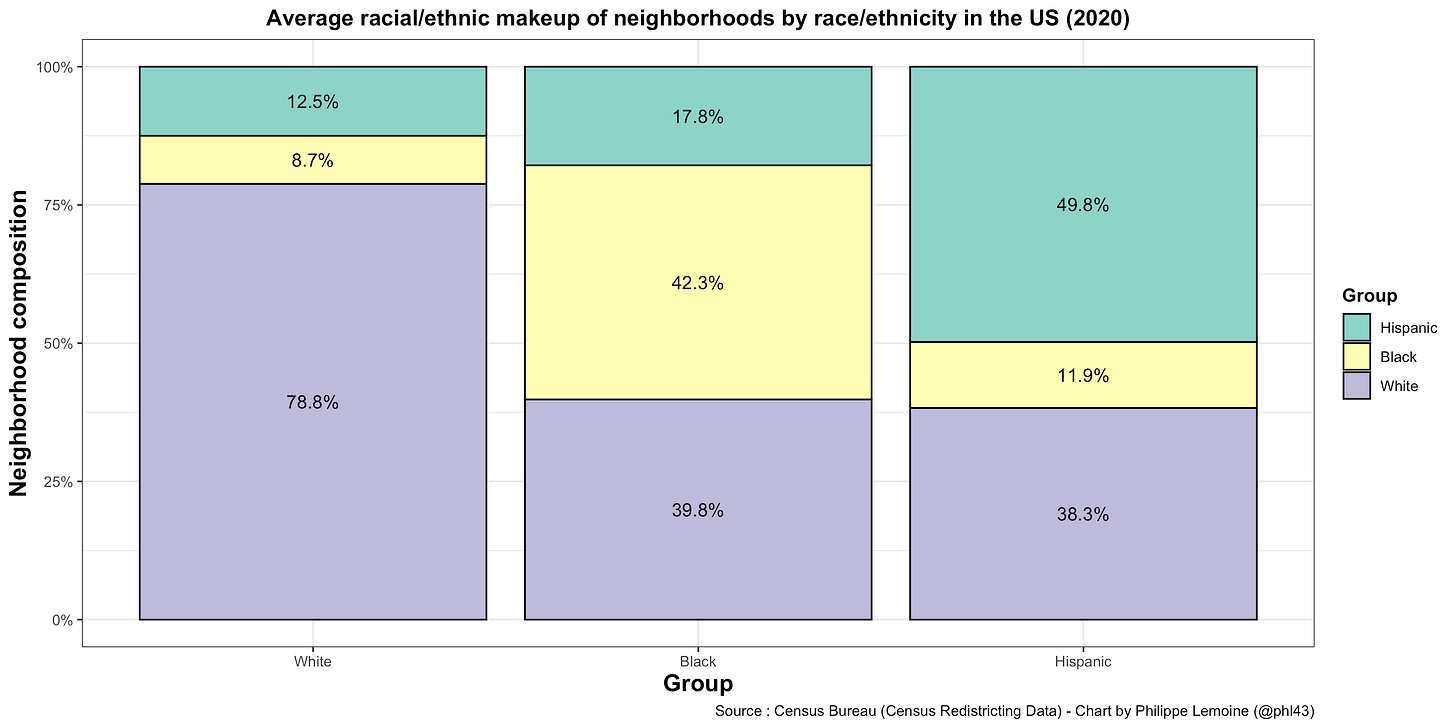
In order to create this counterfactual, I use data from the 2020 Census to compute what sociologists call “exposure indices”, which measure the racial/ethnic composition of the neighborhood of the average person of each racial/ethnic group.5 Here is what the average racial/ethnic makeup of neighborhoods by race/ethnicity in the US looked like in 2020:
The way you should read this chart is that, for example, white people live in neighborhoods where on average 78.8% of the population is white, 8.7% is black and 12.5% is hispanic.6 As you can see, compared to white people, blacks and hispanics have much more exposure to people of a different race/ethnicity. Hence, to that extent, you would expect a larger share of the violent crimes committed by black people and hispanics to involve victims of a different race/ethnicity than in the case of white criminals. On the other hand, the exposure of black people and hispanic to white people is still much lower than their share of the population, which also makes the previous model that didn't take into account segregation misleading. For instance, black people live in neighborhoods where on average 39.8% of the population is white, which is much lower than the white share of the population at the national level.
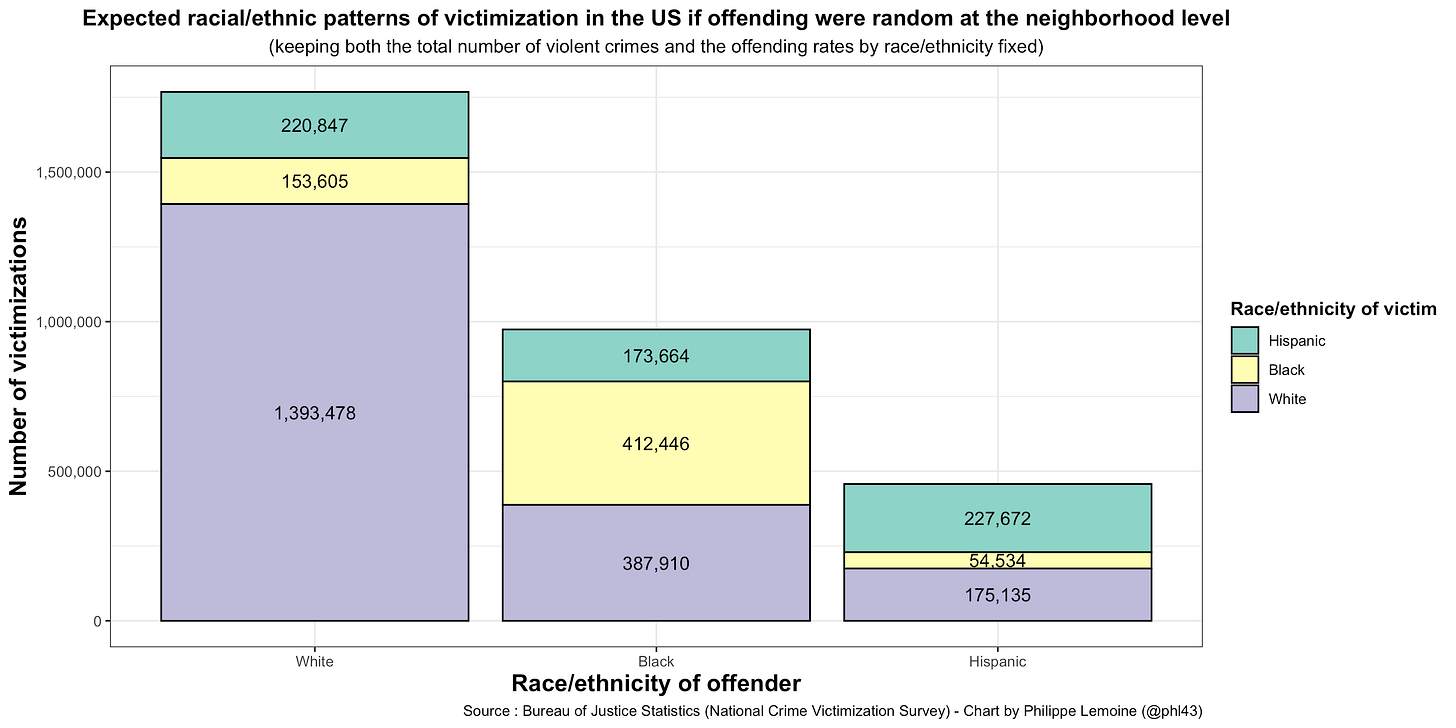
Here is what racial/ethnic patterns of victimization would look like in a counterfactual where, keeping the offending rate of each racial/ethnic group constant, criminals select their victims randomly with probabilities equal to each racial/ethnic group’s share of their neighborhood:
As you can see, this counterfactual is closer to the observed data than when you assume that criminals select their victims randomly at the national level, but the racial/ethnic distribution of victims is still very different. In particular, white people commit more than twice as many crimes against black people than in the actual world, while black people commit 19% less crimes against white people.
This suggests that black criminals have a preference for white victims, whereas on the contrary white criminals have a preference against black victims. In other words, not only does it seem that black criminals “go out of their way to seek out white victims”, but it also seems that white criminals go out of their way to avoid black victims. Of course, the comparison between the observed data and this counterfactual doesn’t prove that because as I noted above even this model is still pretty simplistic and there could be other factors it doesn’t take into account that explain the racial/ethnic victimization patterns actually observed despite the fact that criminals don’t have racially-biased preferences for victims, but it’s probably the best we can do with those data and prima facie that’s what they suggest.7 Note that in the sense I’m using this expression, even if criminals have racially-biased preferences for victims, this may not be because they harbor racial/ethnic animosity toward people of certain races/ethnicities or at least this may not be the only reason. For instance, it could be that if black criminals have a preference for white victims, it’s not or not just because they harbor racial animosity toward white people but also because they perceive them as less threatening so attacking them seems less risky or because they believe they tend to have more things of value on them for violent crimes that are motivated by profit. Indeed, this counterfactual also suggests that white criminals have a preference for white victims (though not as strong), but presumably in their case this isn’t because of racial animus toward white people.
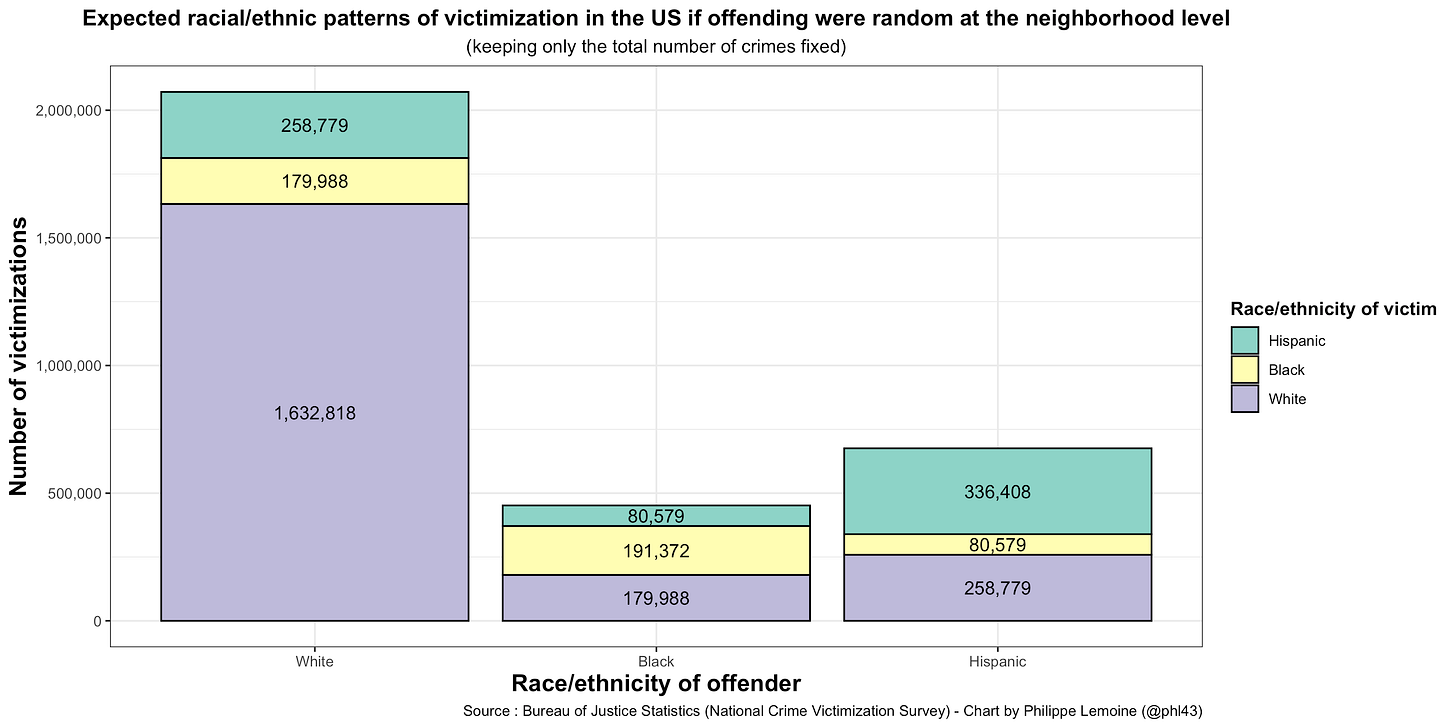
We can also create a counterfactual in which the overall offending rate is held constant relative to the actual world, but there are no racial/ethnic differences in offending rates and criminals victimize people of different races/ethnicities randomly with probabilities equal to their share of the population at the neighborhood level. Here is what the racial/ethnic patterns of victimizing would look like in such a counterfactual:
This counterfactual is probably the best approximation we can get in a quick and dirty way of what racial/ethnic patterns of victimization would look like if criminal behavior were distributed identically across races/ethnicities and criminals had no racially-biased preferences for victims. As you can see, it’s very different from the observed data. In particular, white criminals would commit more than 2.5 times more violent crimes against black people, while black criminals would commit 62% less violent crimes against white people.
Now let’s go back to the original chart that Carr was criticizing. The point that it was making is that, if you listen to the media, you’d think that black people are much more at risk of being victimized by white people than the other way around, but in fact the opposite is true. Although it’s true that omitting intraracial crime from the chart painted a misleading picture of the racial/ethnic patterns of victimization in the US, that point on the other hand was perfectly correct. Indeed, according to the NCVS, a black person is 1/3 less likely to be victimized by a white criminal than a white person is to be victimized by a black criminal. Moreover, contrary to what Carr and other people suggest, this isn’t because there are more white people than black people in the US. In fact, if criminal behavior were distributed identically across races/ethnicities and criminals selected their victims purely at random among the people who live in their neighborhood, black people would be 4.5 more at risk of being victimized by a white criminal than white people would be of being victimized by black criminals.8 The reason why the opposite is true in the actual world is that 1) black people have a much higher offending rate than white people and 2) they seem to have a preference for white victims. Based on anecdotal and indirect evidence, this shouldn’t really surprise anyone, but race and crime is one of those subjects about which people are strongly enjoined to ignore what they see and plenty of people in the academia/media complex are making it easier for them by producing intellectual obfuscation to convince them there is nothing to see, which they buy all the more readily that they are desperate to believe it.
ADDENDUM: As I noted above, a model in which criminals randomly select their victims with probabilities equal to each group’s share of the population in their neighborhood is also unrealistic, because criminals sometimes victimize people outside of their neighborhood. However, not only do I think that it’s probably the best we can do without more data, but I think that it’s probably much better than most people realize, because they have a distorted view of the reality of violent crime. Based on the reactions to this post, many people seem to think that a large share of violent crime is motivated by profit, but if you look at data from the NCVS and read qualitative research you will see that the profit motive is largely absent from violent crime, which mostly results from petty disputes between people who know each other. Thus, according to the NCVS, victims of violent crimes in 2021 were only deprived of property in 10% of the cases and they knew their attacker in 55% of them. While I’m sure that in many cases violent criminals victimize people who don’t live in the same census tract as them, I have little doubt that in the vast majority of cases when they do, their victims nevertheless live in adjacent areas. Therefore, since the racial compositions of neighborhoods exhibit strong spatial correlation, I think the admittedly simplistic model I used is probably much better than most people realize. We could improve on my analysis by allowing neighborhood spillover of crime to see how much of it there needs to be in order to explain the data without assuming that criminals have racially-biased preferences for victims. I didn’t have time to try so I could be wrong, but as I noted above, I think we’d have to assume much more spillover than is realistic in order to do so.
The code for the analysis presented in this post and the charts that accompany it can be found on this GitHub repository.
The NCVS is a large, representative, nation-wide survey conducted by the Bureau of Justice Statistics every year in the US. Respondents are asked if they have been victim of a crime during the past 6 months and, if they have, to provide various details about the circumstances of that crime. In particular, if they saw the offender, they’re asked to describe his race/ethnicity, which is how one can use the NCVS to estimate the racial/ethnic patterns of victimization in the US. The advantage of the NCVS is that, since the data are based on statements made by victims in a representative sample of the population, it includes crimes that were not reported to the police and is not affected by bias in the criminal justice system.
At the end of his thread, Carr very obliquely alludes to the fact that black people have a much higher violent offending rate than other racial/ethnic groups in the US, but suggests that it can be explained by the fact that black people are younger and less wealthy than white people. While this may be part of the story, it’s not the whole story or even most of the story (as the comparison with hispanics, who are younger and have a smaller net worth than black people on average, should immediately make clear), but that’s a story for another time.
Moreover, if criminals sometimes leave their neighborhood to victimize people elsewhere, it could be in part because they have racially-biased preferences for victims and therefore go to places where there are more potential victims of their preferred race/ethnicity.
For the purposes of this analysis, neighborhoods are defined as census tracts, which are statistical subdivisions of counties that average about 4,000 inhabitants but can have as little as 1,200 and as many as 8,000.
As in the rest of this post, I have omitted from the analysis people who identify as another race since, in the table of the Bureau of Justice Statistics that I used for the racial/ethnic patterns of victimization, victims who don’t identify as non-hispanic white, non-hispanic blacks or hispanics are omitted. Thus, when the chart says that e. g. white people live in neighborhoods where on average 8.7% of the population is black, that’s 8.7% of the non-hispanic white/non-hispanic black/hispanic population and relative to the total population of the neighborhood the white exposure to black people is even lower. See the code on GitHub for details on how I dealt with people who identify with more than one race.
In particular, if you complicate the model by allowing spillover of crime into neighboring areas simply because people interact with people outside of their neighborhood and it sometimes results in violence, I’m sure you can explain the observed data without assuming that criminals have racially-biased preferences for crime, but I think you will have to make extreme and unrealistic assumptions about how much spillover there is to do so and that otherwise the conclusion will remain qualitatively unchanged.
Again, the model I used to create this counterfactual is pretty simplistic so I wouldn’t take the precise estimates very seriously, but the conclusion is clearly qualitatively correct.

This is a good analysis, but I guess I'm left wondering whether the NCVS is reliable, more than anything. Murder, of course, is only a small % of violent crime (<1), but there blacks are victimized at a much higher rate than their share of the population (about 4x). Is it reasonable that they are the victims of non-fatal violence at a lower rate than their population and a much lower rate than their murder? This seems to strain credulity.
Interviews with criminals may be relevant. In Wright and Decker’s Armed Robbers in Action, they interview a few dozen (mostly black) active robbers in St. Louis (snowball sampled through a reformed ex-robber). Robbers consider several factors when deciding who to rob, and there is some disagreement among them on who is the best target. But there was general agreement that whites were safer targets — less likely to fight back. Given the demographics of local neighborhoods race probably is a decent indicator of whether someone has experience with violence or follows the code of the streets with its ethic of retaliation and toughness.